
Using Data As A Weapon In The WGA Strike
Don't be swayed by the Dark Side of data

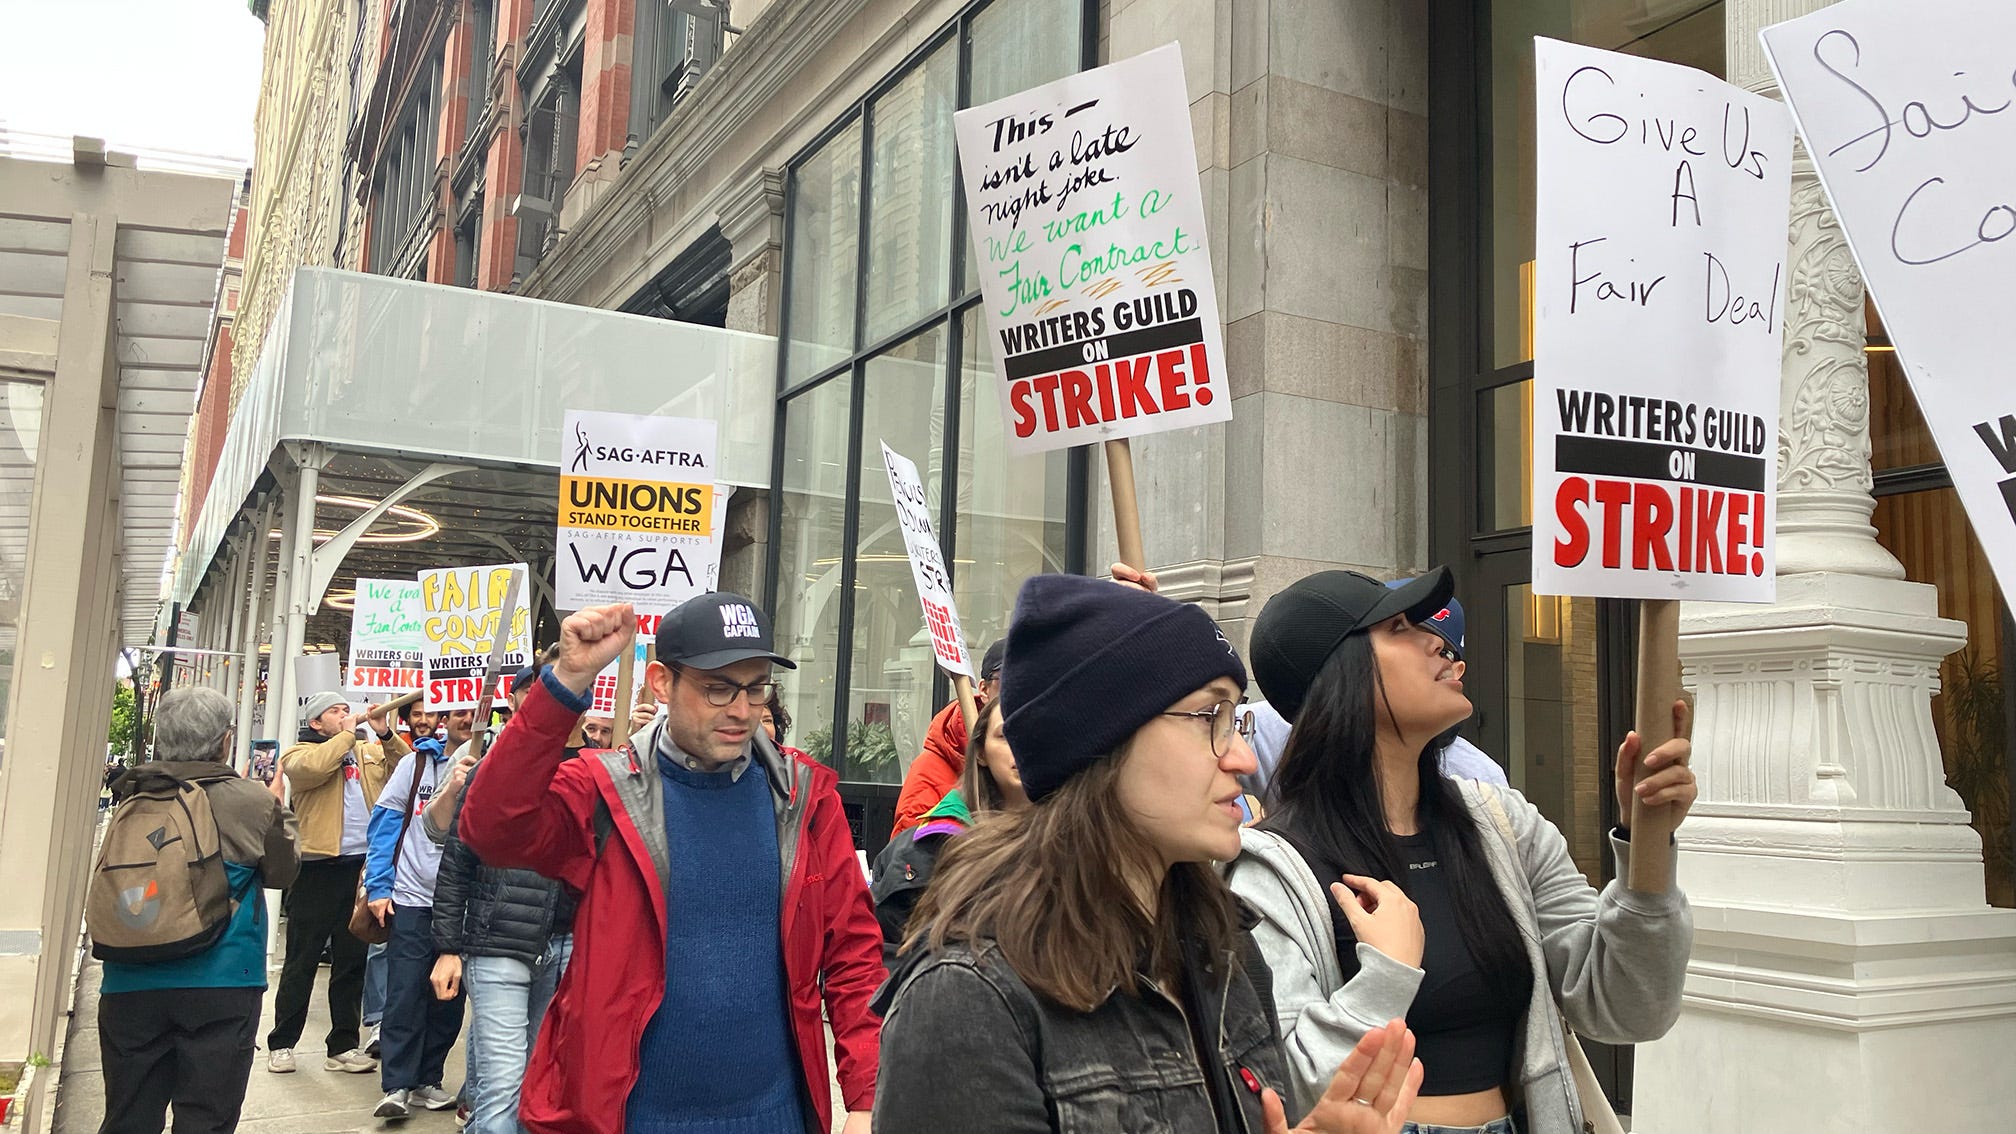
Hollywood news sites have been plastered with updates on the WGA (Writers Guild of America) strike and their negotiations with AMPTP (Alliance of Motion Picture and Television Producers). The WGA voted to strike after the talks with AMPTP failed. You can find a detailed list of WGA proposals and AMPTP offers here. I’m not a labor negotiator or Hollywood production expert, so I won’t weigh in on the specifics of the proposal. But late last week, the AMPTP released a public rebuttal for each conflict area with the writers union.
I don’t know how accurate their numbers are (if you know the history of WGA pay schedules and contracts, please get in touch, and I’ll update this post with the accuracy/bogusness of the numbers - we can see where this lies on the spectrum of deceitful to merely sloppy data language!). Still, I do know that the language the AMPTP used to provide data and statistics is strewn with poor data presentation. By using language that gives little context and maximum perceived effect, they are using data as a weapon. You see it in companies and media all the time, so unfortunately, the public is getting numb to it. But I hope that by highlighting these practices as we see them, we can build our awareness. So let’s go through their document to see how data language can be deceiving and what would be a better way to present it.
Wage Increases
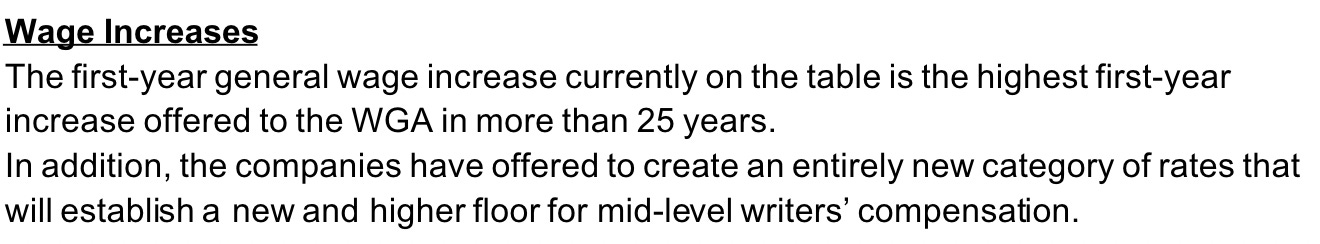
The first sentence regarding wage increases is a common issue where the writer doesn’t provide a base rate and amount. The wage increase may be the largest in over 25 years, but if they’ve previously only gotten 0.1% increases, that’s probably okay! In any case where you provide rates, giving an average or median base amount is also helpful. 5% of $1m is much better than 5% of $1. A better way to phrase this would be, “The current proposal of a v% wage increase is the largest in 25 years. Over that time, the average increase has been w% annually with real pay increasing from X to Y.” This phrasing provides context and doesn’t send the reader on a wild goose chase for numbers to see if this statement is reasonable.
The second sentence needs some context as well. How do they define a mid-level writer? What percentage of the population of WGA writers are they? What’s the new floor, and what was the previous one? A common way to pick apart a group is to incentivize a small portion of the group that will make them agree with your position and break the majority. Without understanding how large the population is or how much this is helping them, it's difficult to determine the intent.
Streaming Residuals
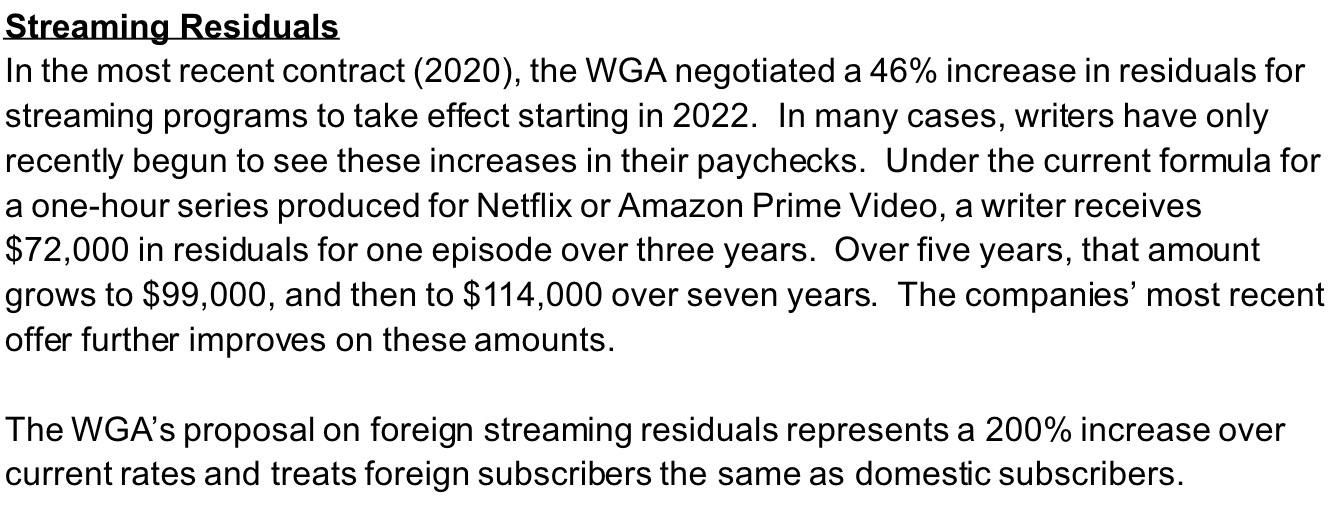
The Streaming Residuals section continues to make me cringe from a lack of base rates and amounts. 46% increase of what?! 200% increase from what current rate?! Honestly, this is a theme throughout the document.
The interesting part about this section is their example of streaming residuals from Netflix and Amazon Prime. Over the last few years, it’s been widely reported that these two streaming giants have “overpaid” for a lot of content to build their brand and market share. So the example they provide is for two of the highest-paying companies in the industry. I imagine that the fraction of writers who ever get a series on either platform is minuscule, and most writers consider it a top-paying gig. So by using this example, it allows the AMPTP to use larger numbers that imply an already elite pay level. Using an example at the median pay level or providing percentiles would reflect a more genuine picture of current residuals.
The Gig Economy
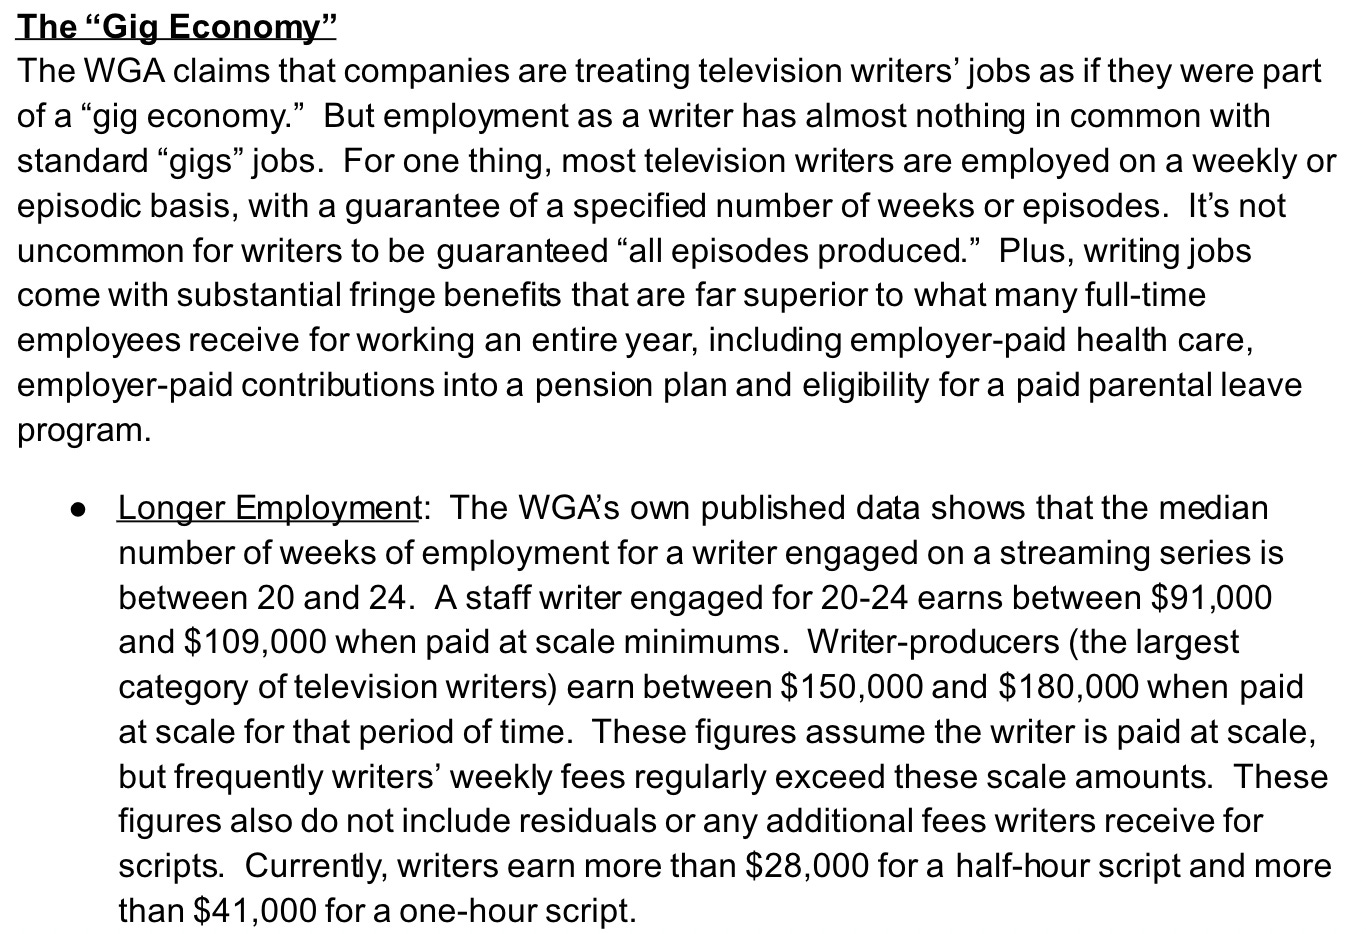
Digging into the section on the Gig Economy, the discussion of pay for subpopulations starts to get confusing. Throughout the paragraph on longer employment, they use stats for “a writer engaged in a streaming series,” “a staff writer [paid as scale minimums],” “writer-producers,” “television writers,” and “writers.” That’s a lot of sub-categories! Without understanding how those subpopulations overlap or how big they are, it’s hard to understand if their stats are reasonable. For instance, they call writer-producers the largest category of television writers. Are television writers defined by what medium they write for most? What percentage of the time would a 20-24 week streaming writer spend as a writer-producer? They also mention that “writers’ weekly fees regularly exceed these scale amounts” but don’t cite how often, for how many writers, and by what amount.
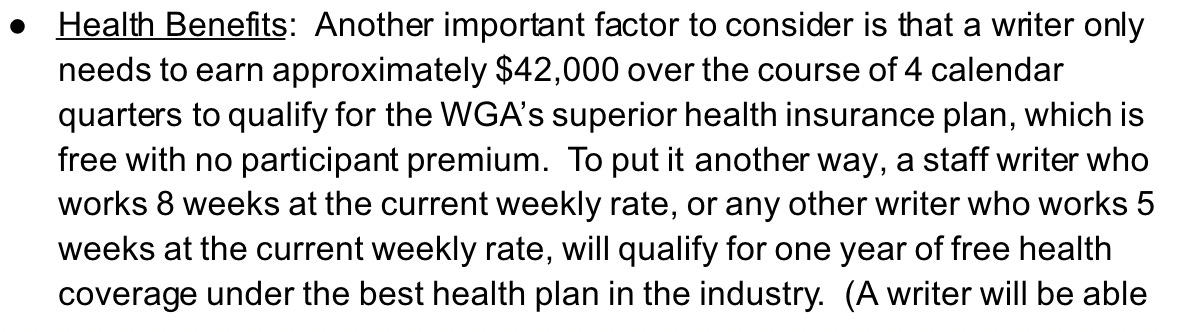
Under the Health Benefits paragraph, it would be helpful to note what percentage of writers earn the $42,000 benchmark for healthcare and what percentage buy supplemental health insurance (admittedly, a hard number to get, but they could survey the WGA). This isn’t terribly egregious, but it would give the reader a better idea of how much of an issue healthcare should be in the negotiation.
Development Rooms

The pay structure mentioned in the Development Room section is another Venn diagram that would be easier to understand with more context. The pay distribution of writers will depend on how many weeks they tend to spend in development rooms, what percentage of programs employ writers before commitment and how many writers encounter that situation, how many writers work on high-budget SVOD series’ and what the average fee is for early employment and SVOD series. Without all this context, you can portray the pay ranges and structures in various ways to fit your narrative.
Non-Dramatic Programs
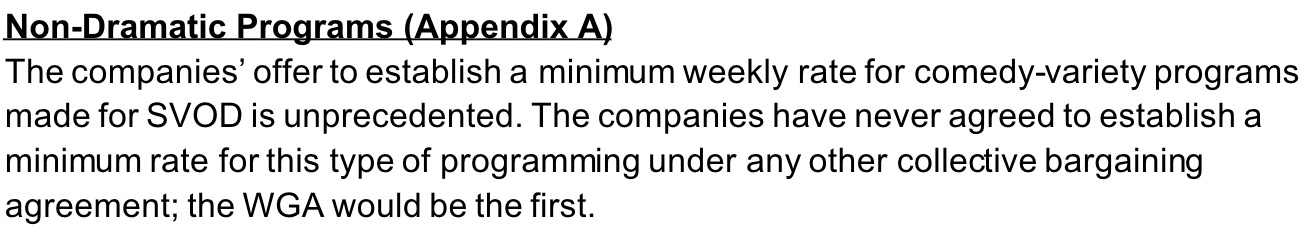
The last section for Non-Dramatic Programs has similar context issues as the other portions. We need to know the current rates and fees to understand the impact of the minimum rate for non-dramatic programs. What are the rates for comedy SVOD programs? What percentage of programming and writers’ time does that take up?
Overall, you might look at my collective gripes and suggest that much of this context wasn’t provided because the response was made for the WGA, who should already know these things. But it was explicitly released to the media and public to shape perception. The only parties that tend to understand the in’s and out’s of labor contracts tend to be labor lawyers, so a good faith document for public consumption requires a lot of context and examples to explain their stance. Most employees don’t even know their rights when it comes to labor contracts!
Hopefully, this overview provides some examples of using data as a weapon. It’s a deception so common I could make a whole newsletter with daily examples. But as a wise philosopher once said, “Knowledge is power.” Better to recognize bad data stories when you see them.